There are two ways to check your agency’s data quality on this page for Quarter Two of 2016.
First, there is a linked spreadsheet that contains the individual data quality percentages for each agency and project by individual data element. This spreadsheet includes all data elements, and it reflects the percentage of enrollments that had a response to each data element excluding “Client Doesn’t Know,” “Client Refused,” and “Data Not Collected.”Please click here to view the spreadsheet.
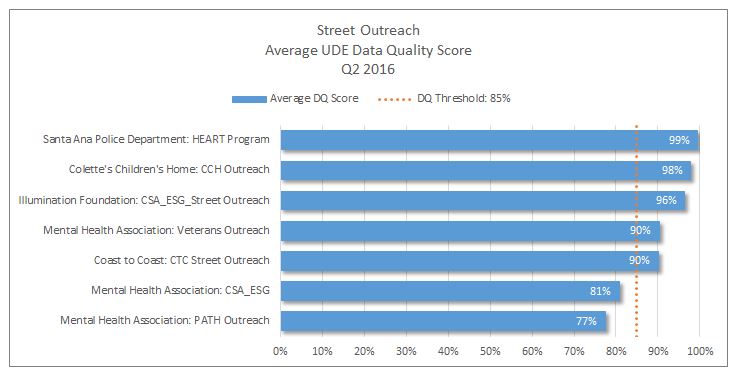
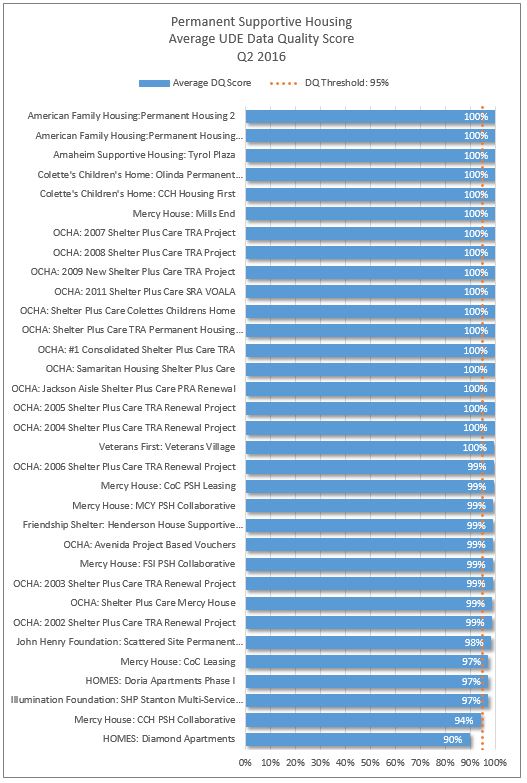
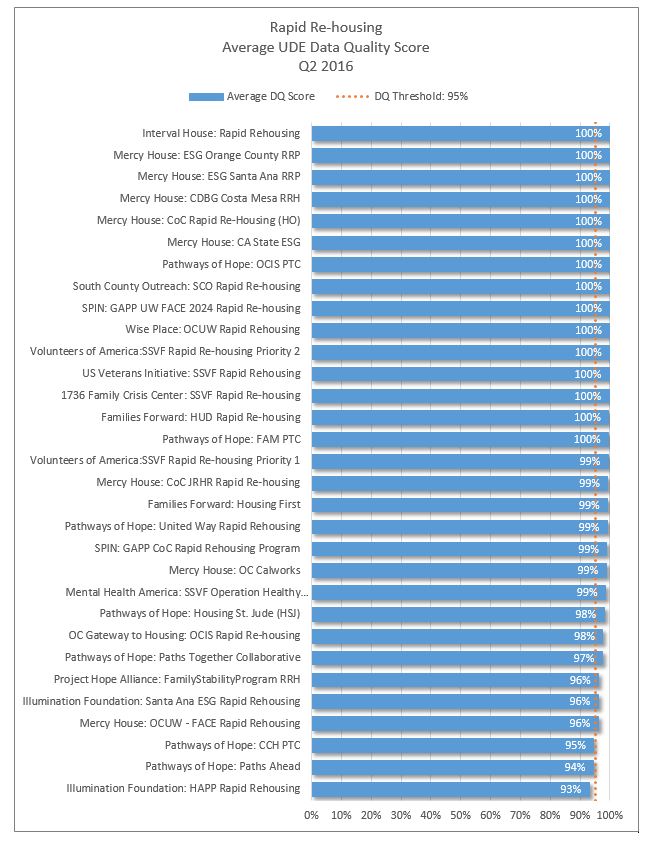
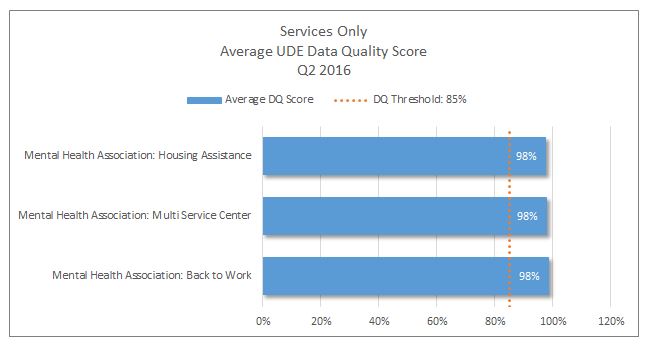
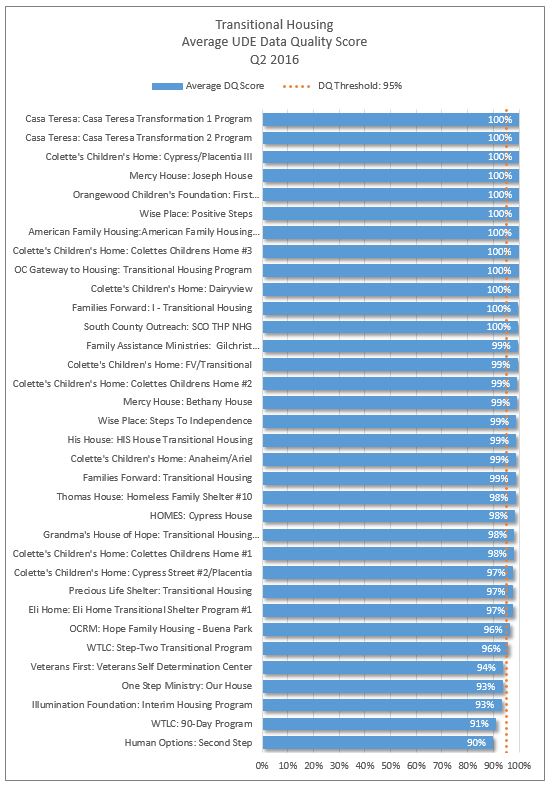
Second, there are graphs below that rank each project’s average data quality for Universal Data Elements by program type. The percentages reflected in these graphs represent the average percentage of all Universal Data Elements that are required for all clients. For example, they do not include Destination (which is only required for clients that have exited) or Total Number of Months Homeless in Past 3 Yrs (which is only required for clients that has four or more episodes of homelessness).
We recommend that you work on making your average data quality percentage the best it can be, as these percentages may be used in future NOFA rankings. If you have any questions about your average data quality, please contact the HMIS Helpdesk.