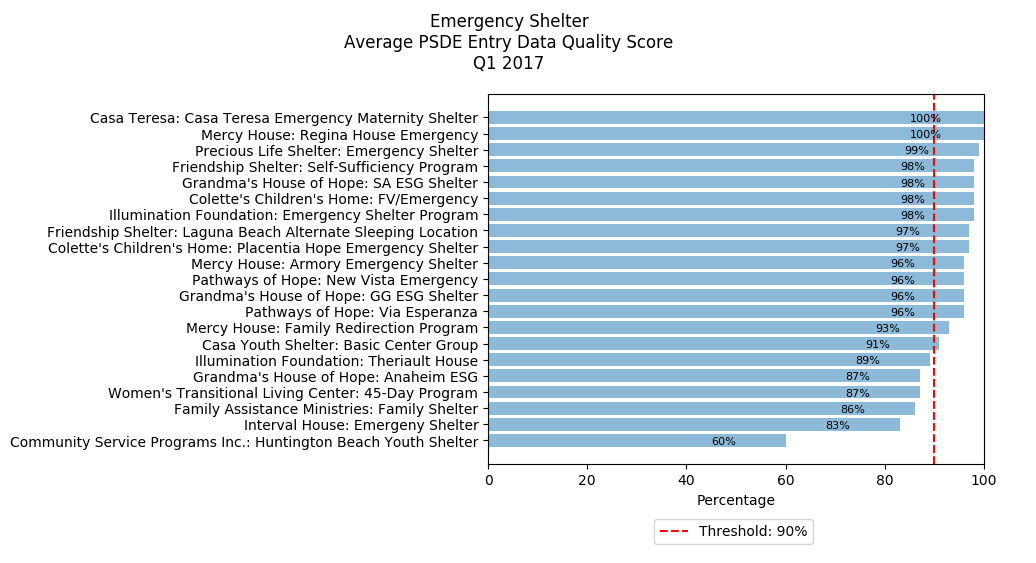
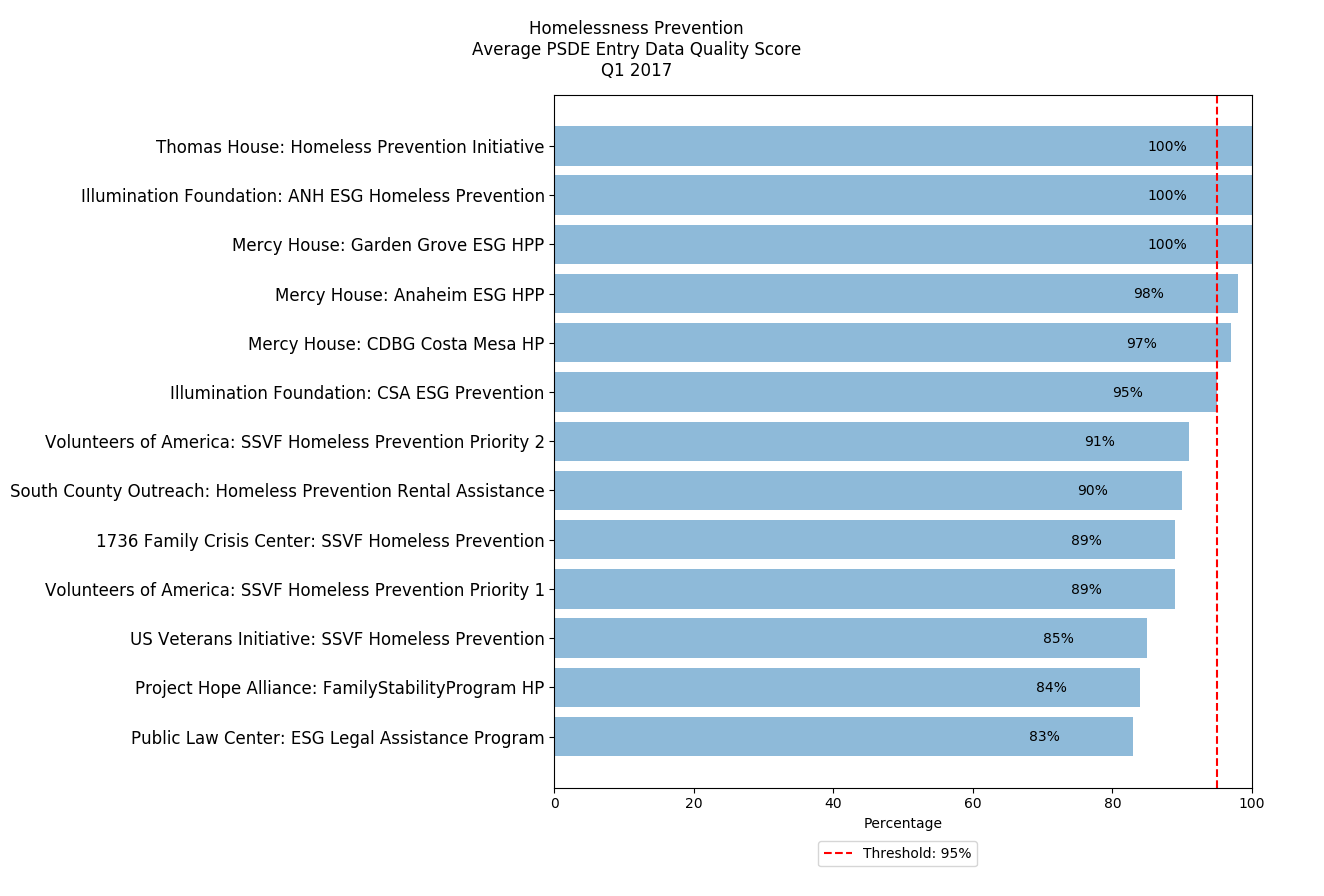
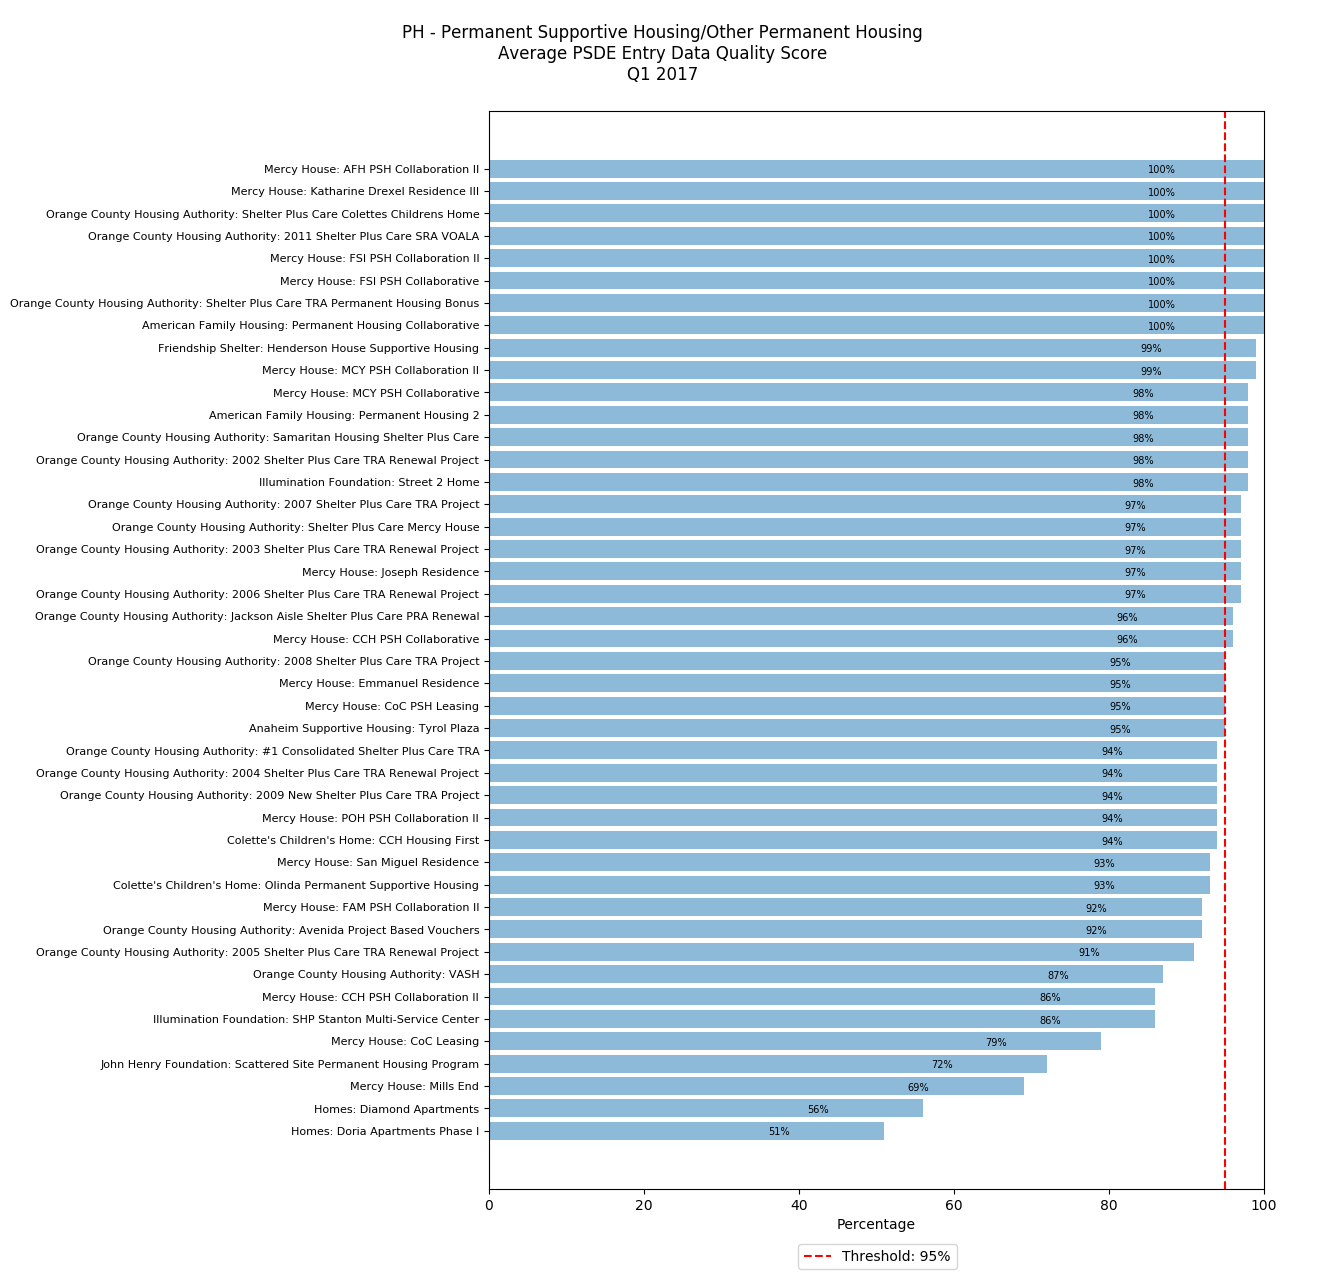
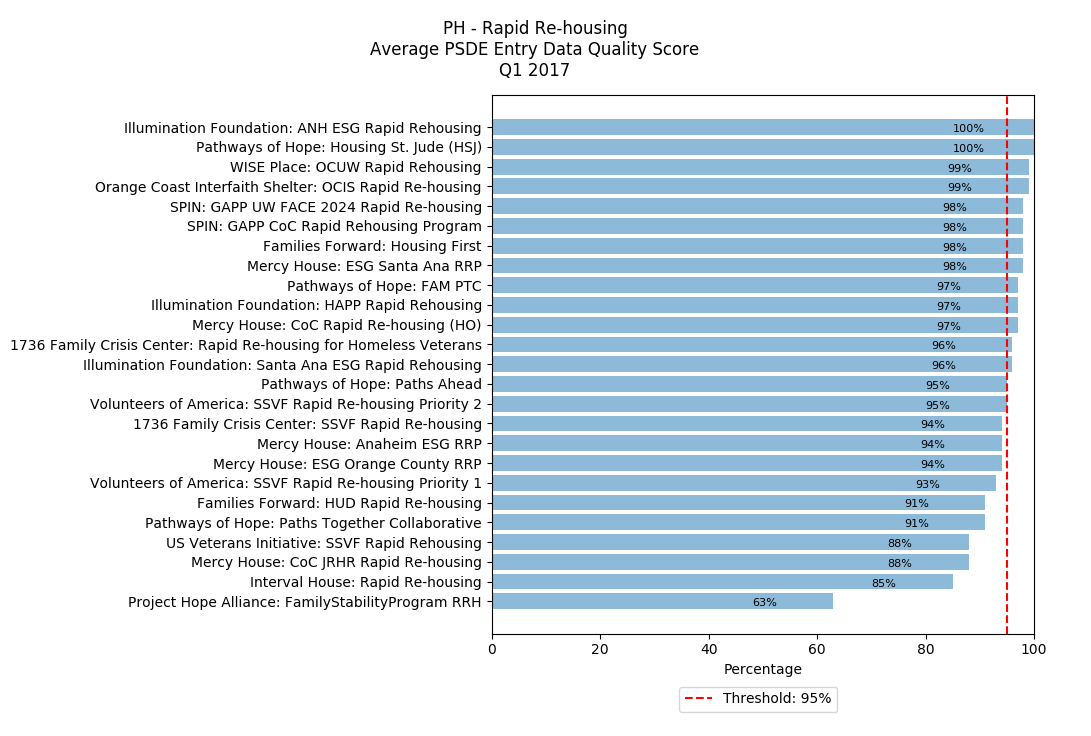
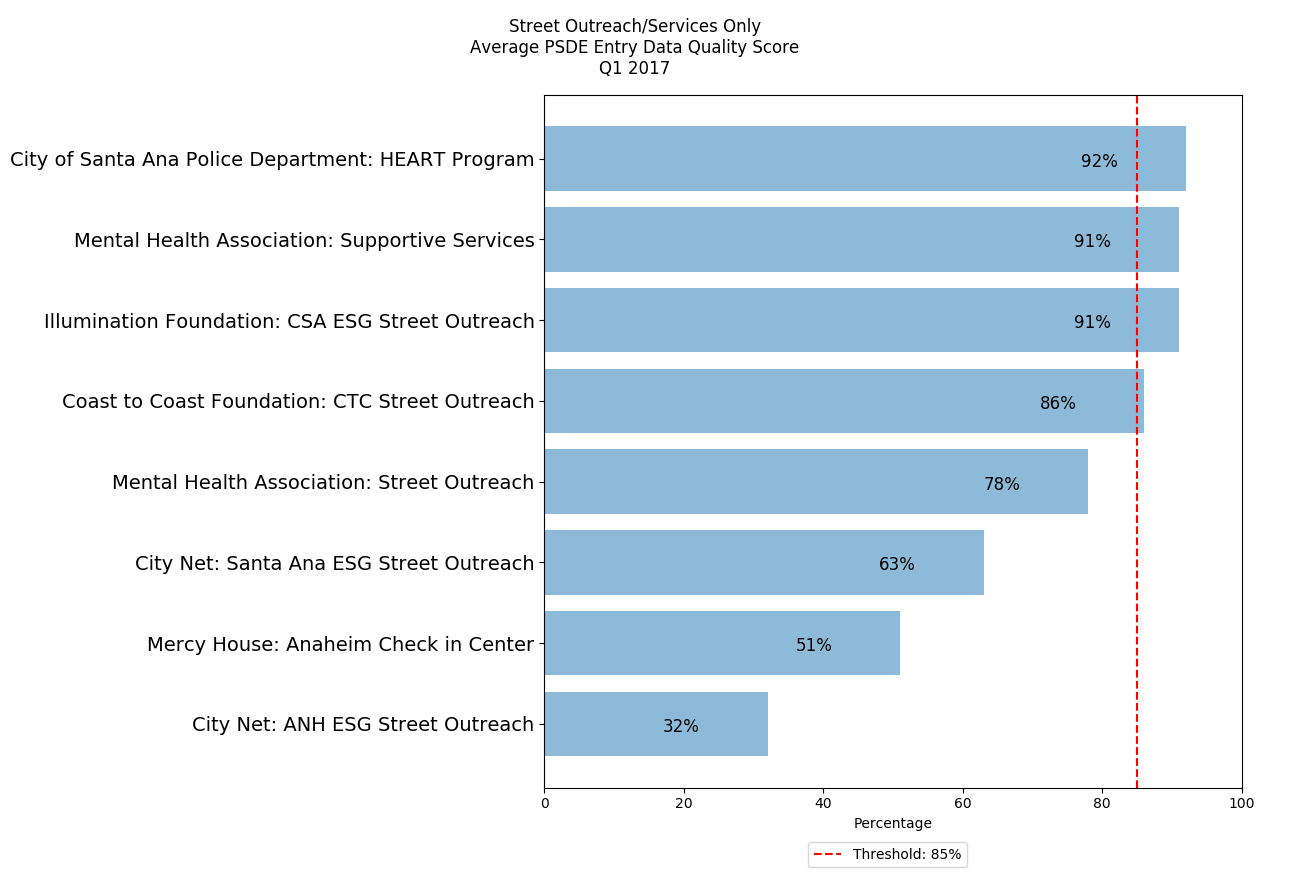
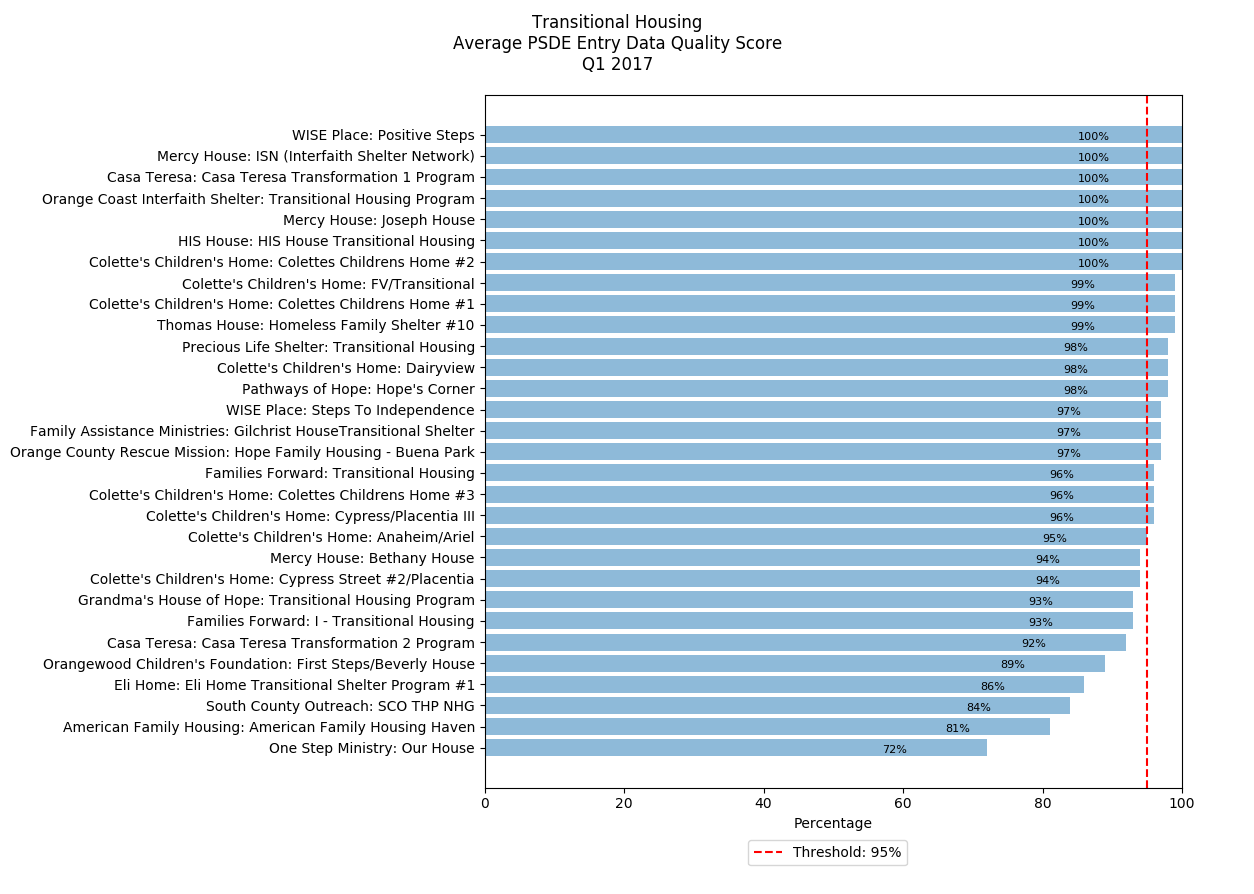
The graphs below rank each project’s average Program Specific Data Elements – Entry data quality score by program type. The percentages reflected in these graphs represent the average percentage of responses entered for all Program Specific Data Elements at Entry, including data elements specific any federal funding the project may receive, for all active clients during the reporting period (1/1/17 – 3/31/17).